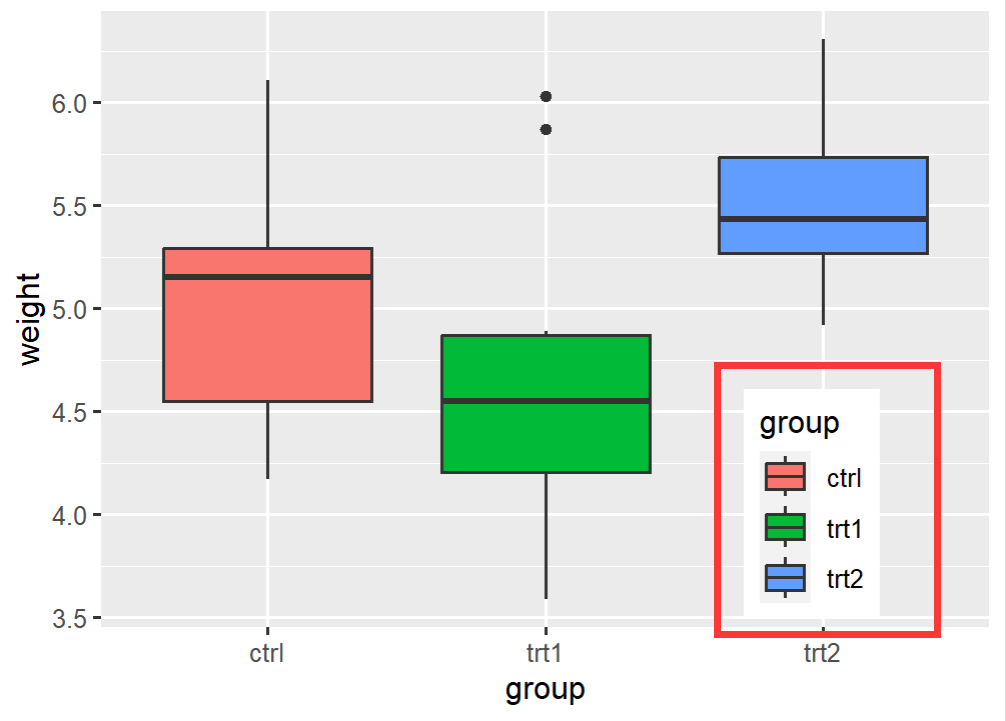
001、默认绘图
bp <- ggplot(PlantGrowth, aes(x=group, y=weight, fill=group)) +
  geom_boxplot()    ## 绘图
bp                  ## 输出图片

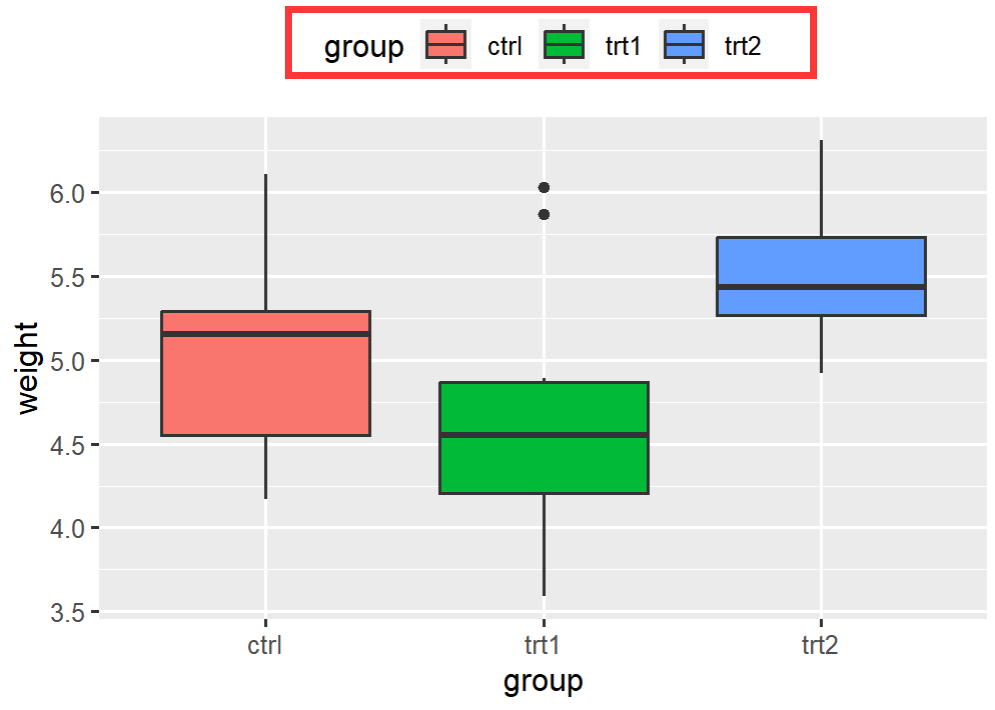
002、上部
bp + theme(legend.position="top") ## 放在上部
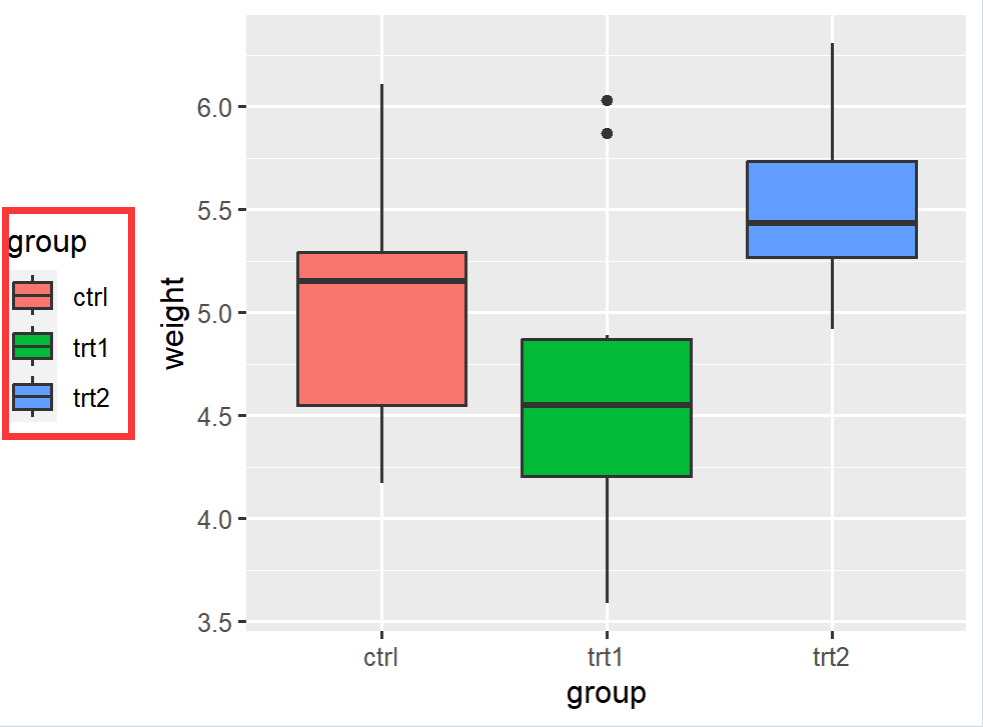
003、左侧
bp + theme(legend.position="left") ## 左侧
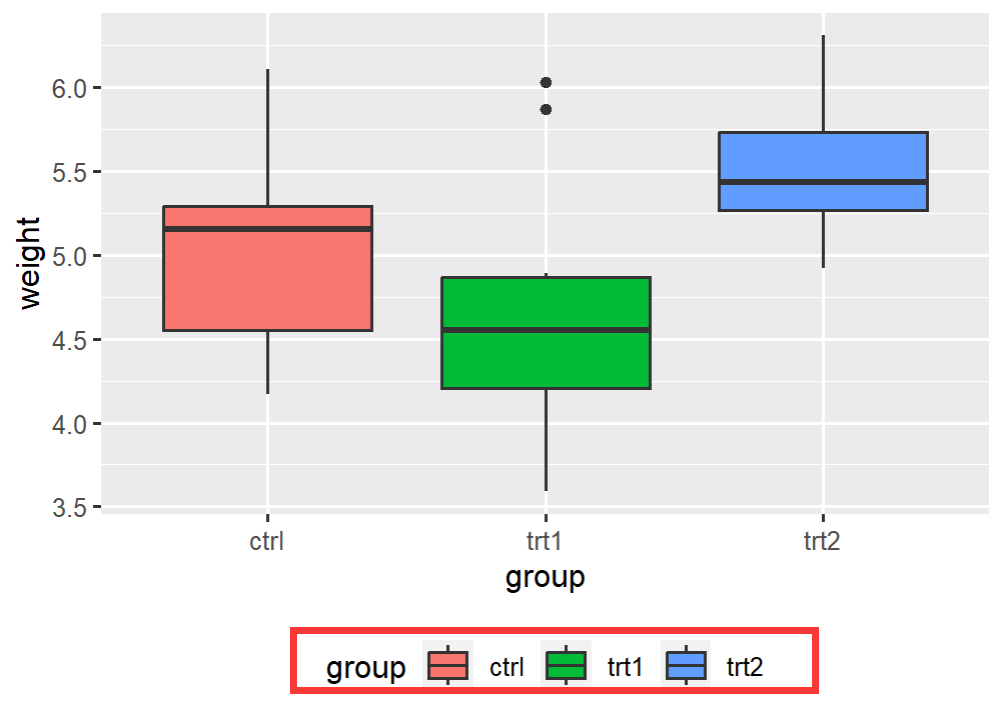
004、下部
bp + theme(legend.position="bottom") ## 下部
005、 也可以根据坐标来设置图例的位置, 左下角为 (0,0), 右上角为(1,1)
bp + theme(legend.position=c(.8, .2))